01
Name the statistical question
Write the population or process, sample, variables, parameter or relationship of interest, and the exact conclusion the problem asks you to support. Separate description, estimation, prediction, and causal claims.
Practical guide
Statistics becomes understandable when every calculation stays attached to a question, a population, a sample, variables, a study design, assumptions, and a conclusion in context. Start with the data-generating process, explore what the data show, choose and check a method, interpret uncertainty, then retrieve the reasoning again without the worked answer.
Available on iPhone · Photo problems, worked reasoning, five calculators, quizzes, flashcards, and references
What to look for
A correct-looking number can still answer the wrong question. Make the population, sample, variables, design, assumptions, uncertainty, and limits visible before trusting the arithmetic.
Write the population or process, sample, variables, parameter or relationship of interest, and the exact conclusion the problem asks you to support. Separate description, estimation, prediction, and causal claims.
Sketch or inspect an appropriate plot, describe center, spread, shape, relationships, missingness, and unusual values, then connect those features to the proposed model instead of jumping directly to a formula.
Verify how observations were produced, whether independence or randomization is justified, which distributional conditions matter, whether units match, and whether the chosen method answers the actual question.
State the result in context with uncertainty and limitations. Close the solution, rebuild the setup from memory, and later mix it with nearby problem types so you must choose the method from the evidence.
Step by step
Identify the question, population or process, sample, observational units, variables, parameter, and study design. Mark what was randomized, what was merely observed, and what cannot be inferred from the design.
Draw or inspect a plot and summarize the data in context. Look for shape, center, spread, clusters, relationships, missing values, outliers, and possible data-quality problems before selecting a test or calculator.
Decide whether the task is descriptive, inferential, predictive, or causal. Match the method to the variable types, number of groups, dependence structure, sampling or assignment process, and conditions—not to a familiar keyword alone.
Write hypotheses or the target quantity, define symbols, keep units visible, state assumptions, calculate, and independently check the formula, inputs, arithmetic, test direction, degrees of freedom, rounding, and magnitude.
Explain the estimate, interval, p-value, effect, or prediction in the problem context. Distinguish statistical significance from practical importance, then reconstruct the setup without notes and revisit it after a delay.
AI can misread a table or plot, invent an assumption, choose the wrong model, or overstate causation and certainty. Do not use one generated result as the basis for medical, financial, legal, safety, research, or policy decisions.
Inside the app
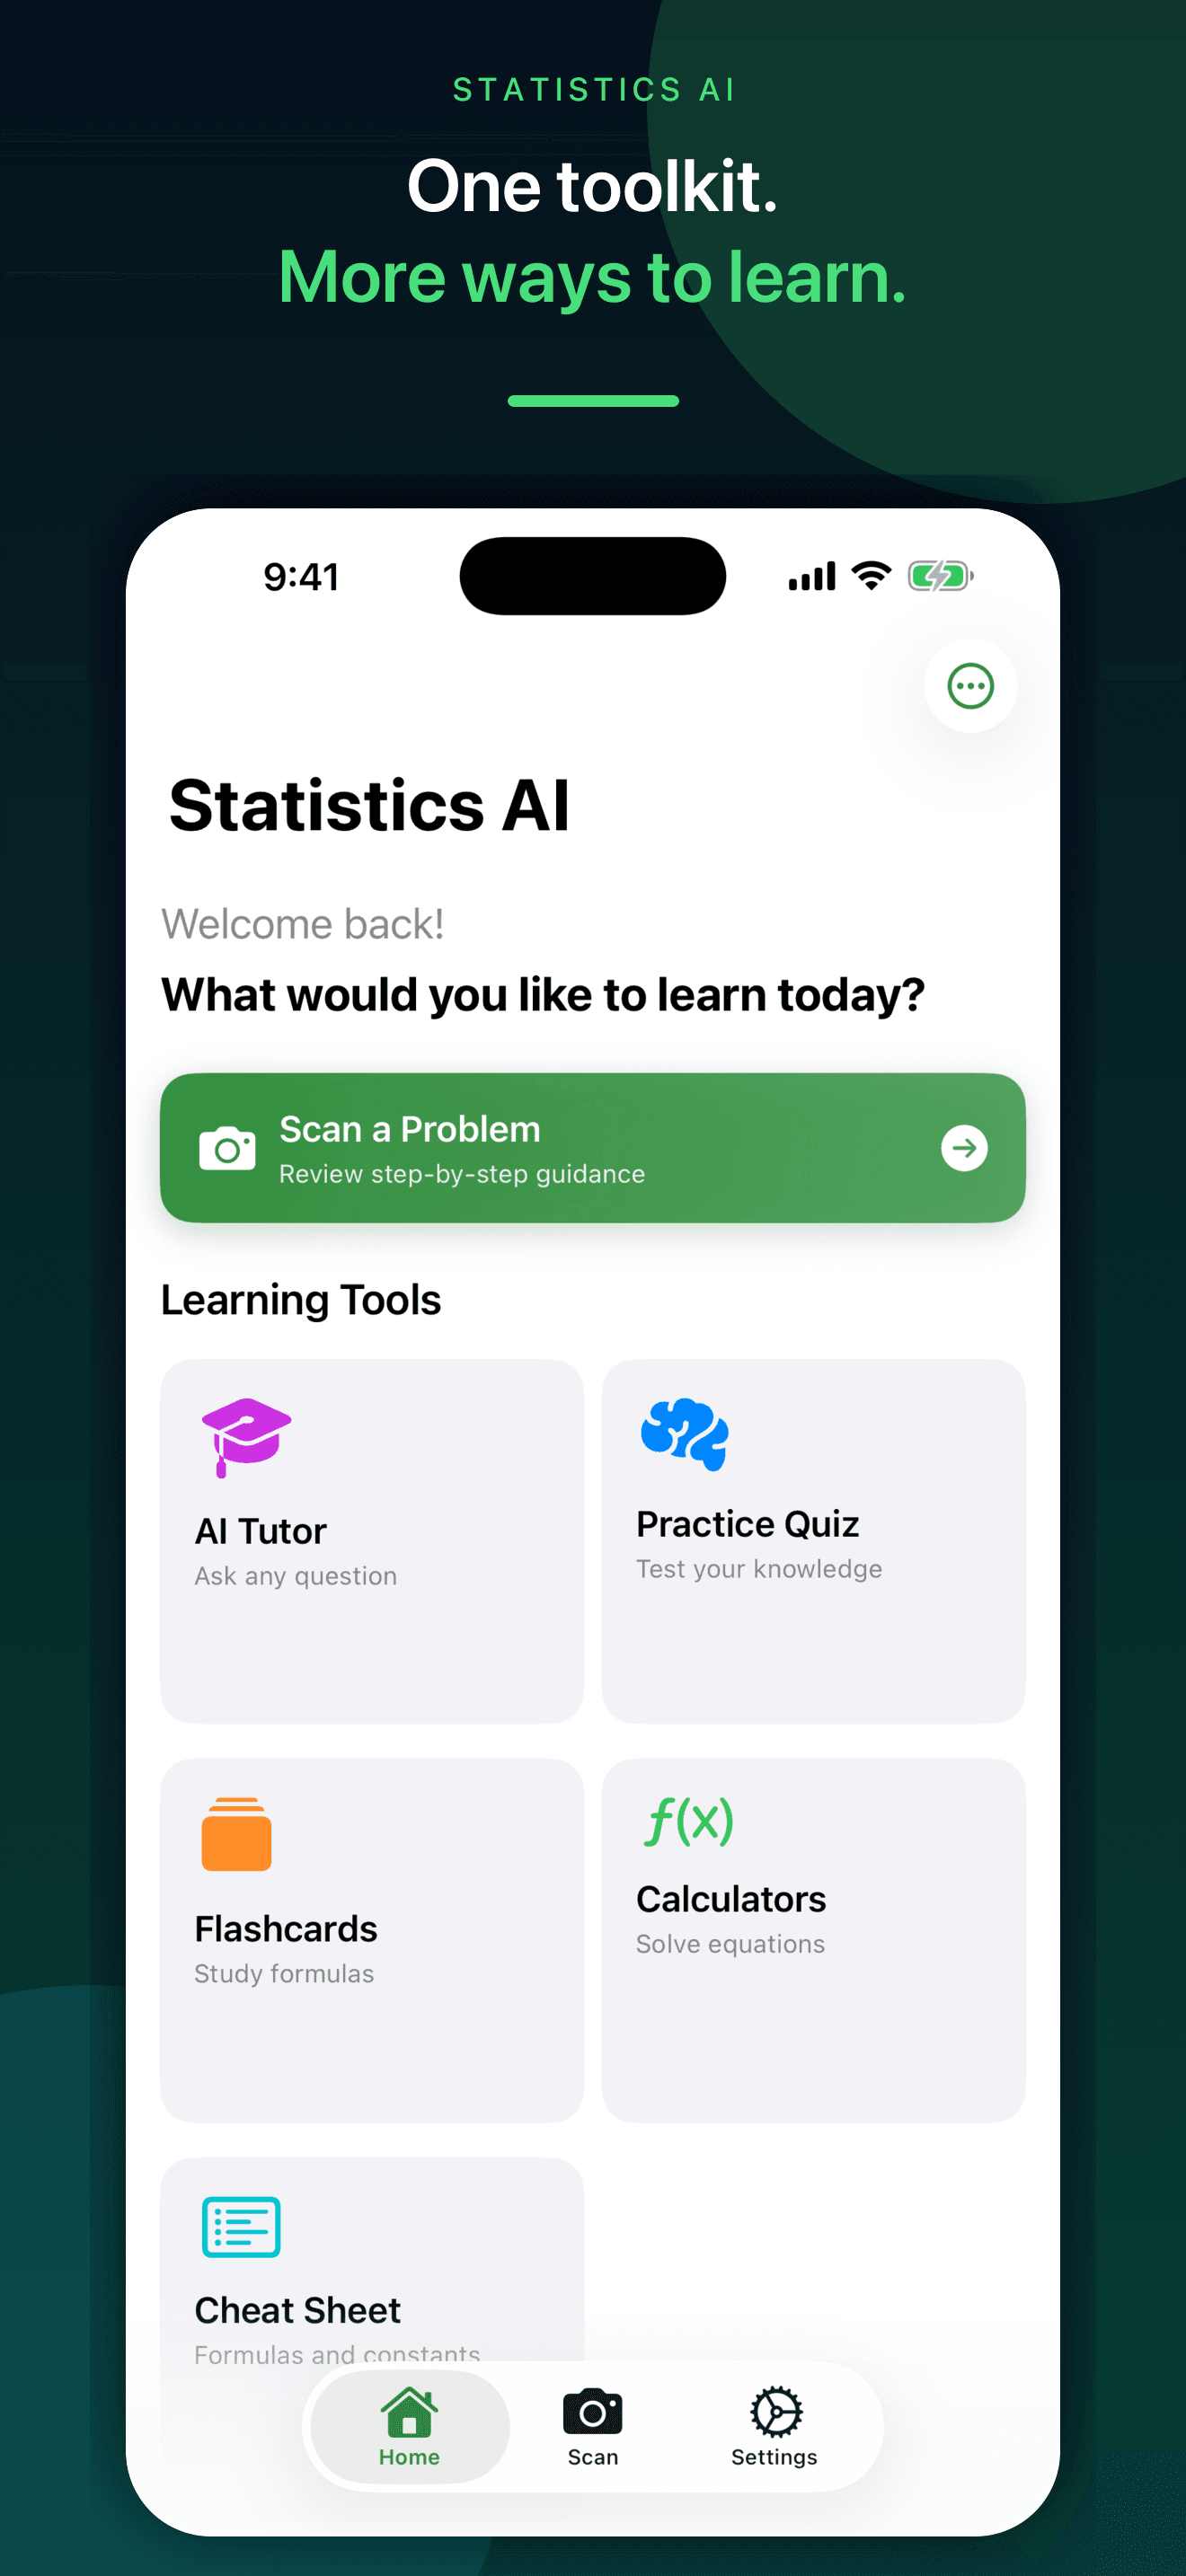
These are actual Statistics AI screens using fictional DEBUG-only showcase data. The app can organize a possible method, assumptions, formulas, numbered reasoning, calculations, quizzes, flashcards, and references. AI can still misread the source, choose an unsuitable method, or generate a confident but invalid interpretation.
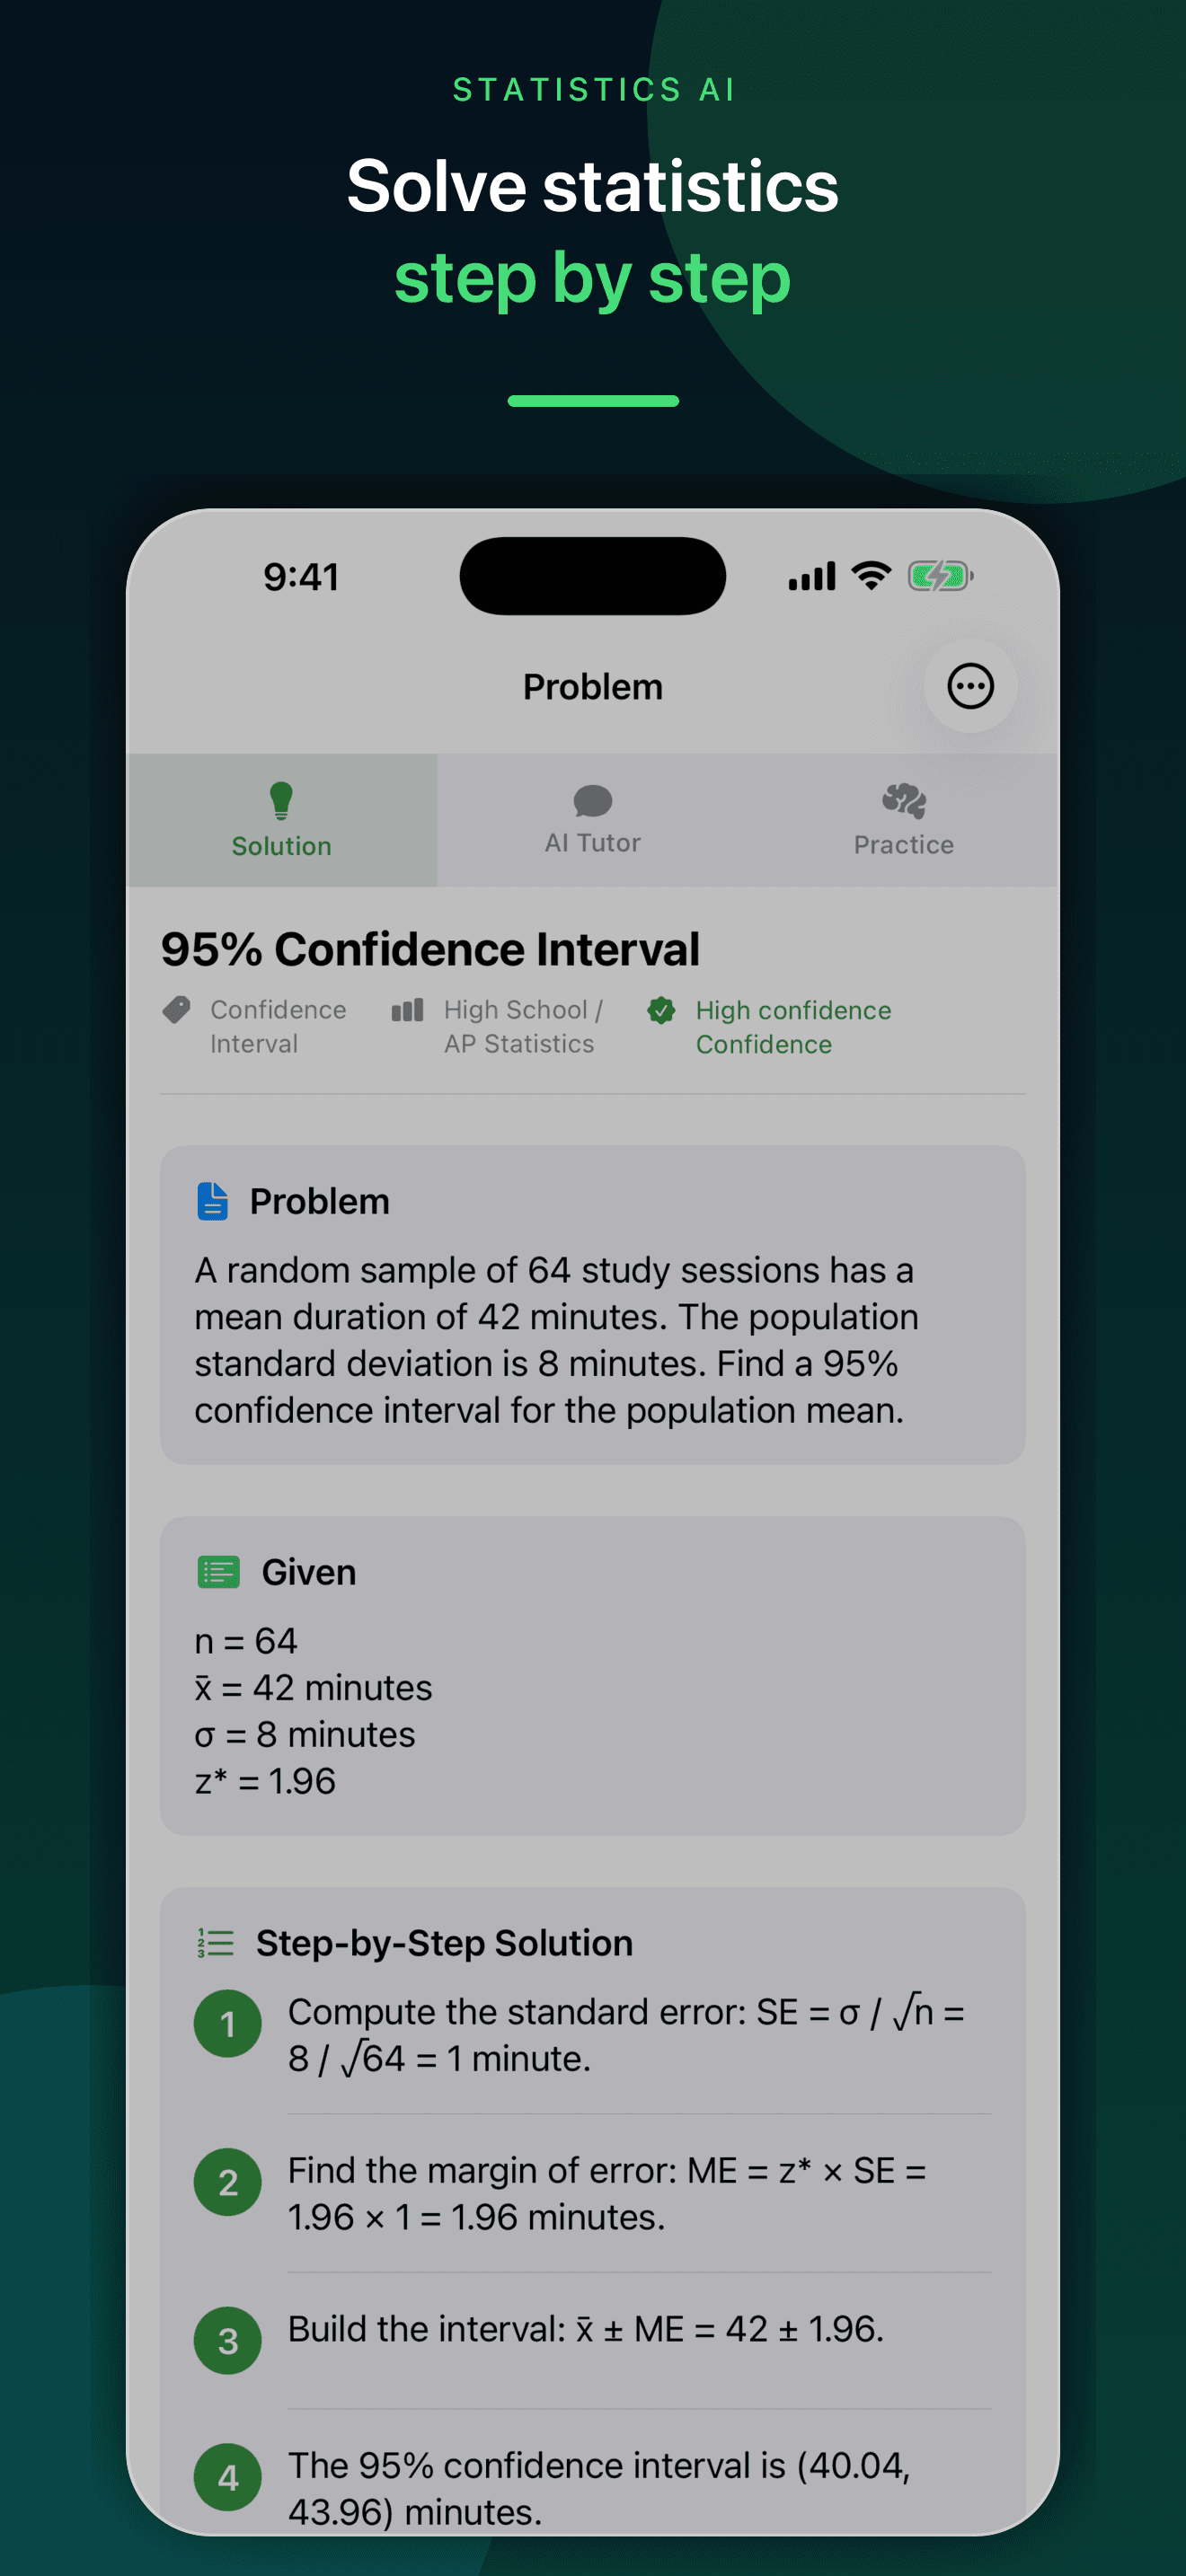
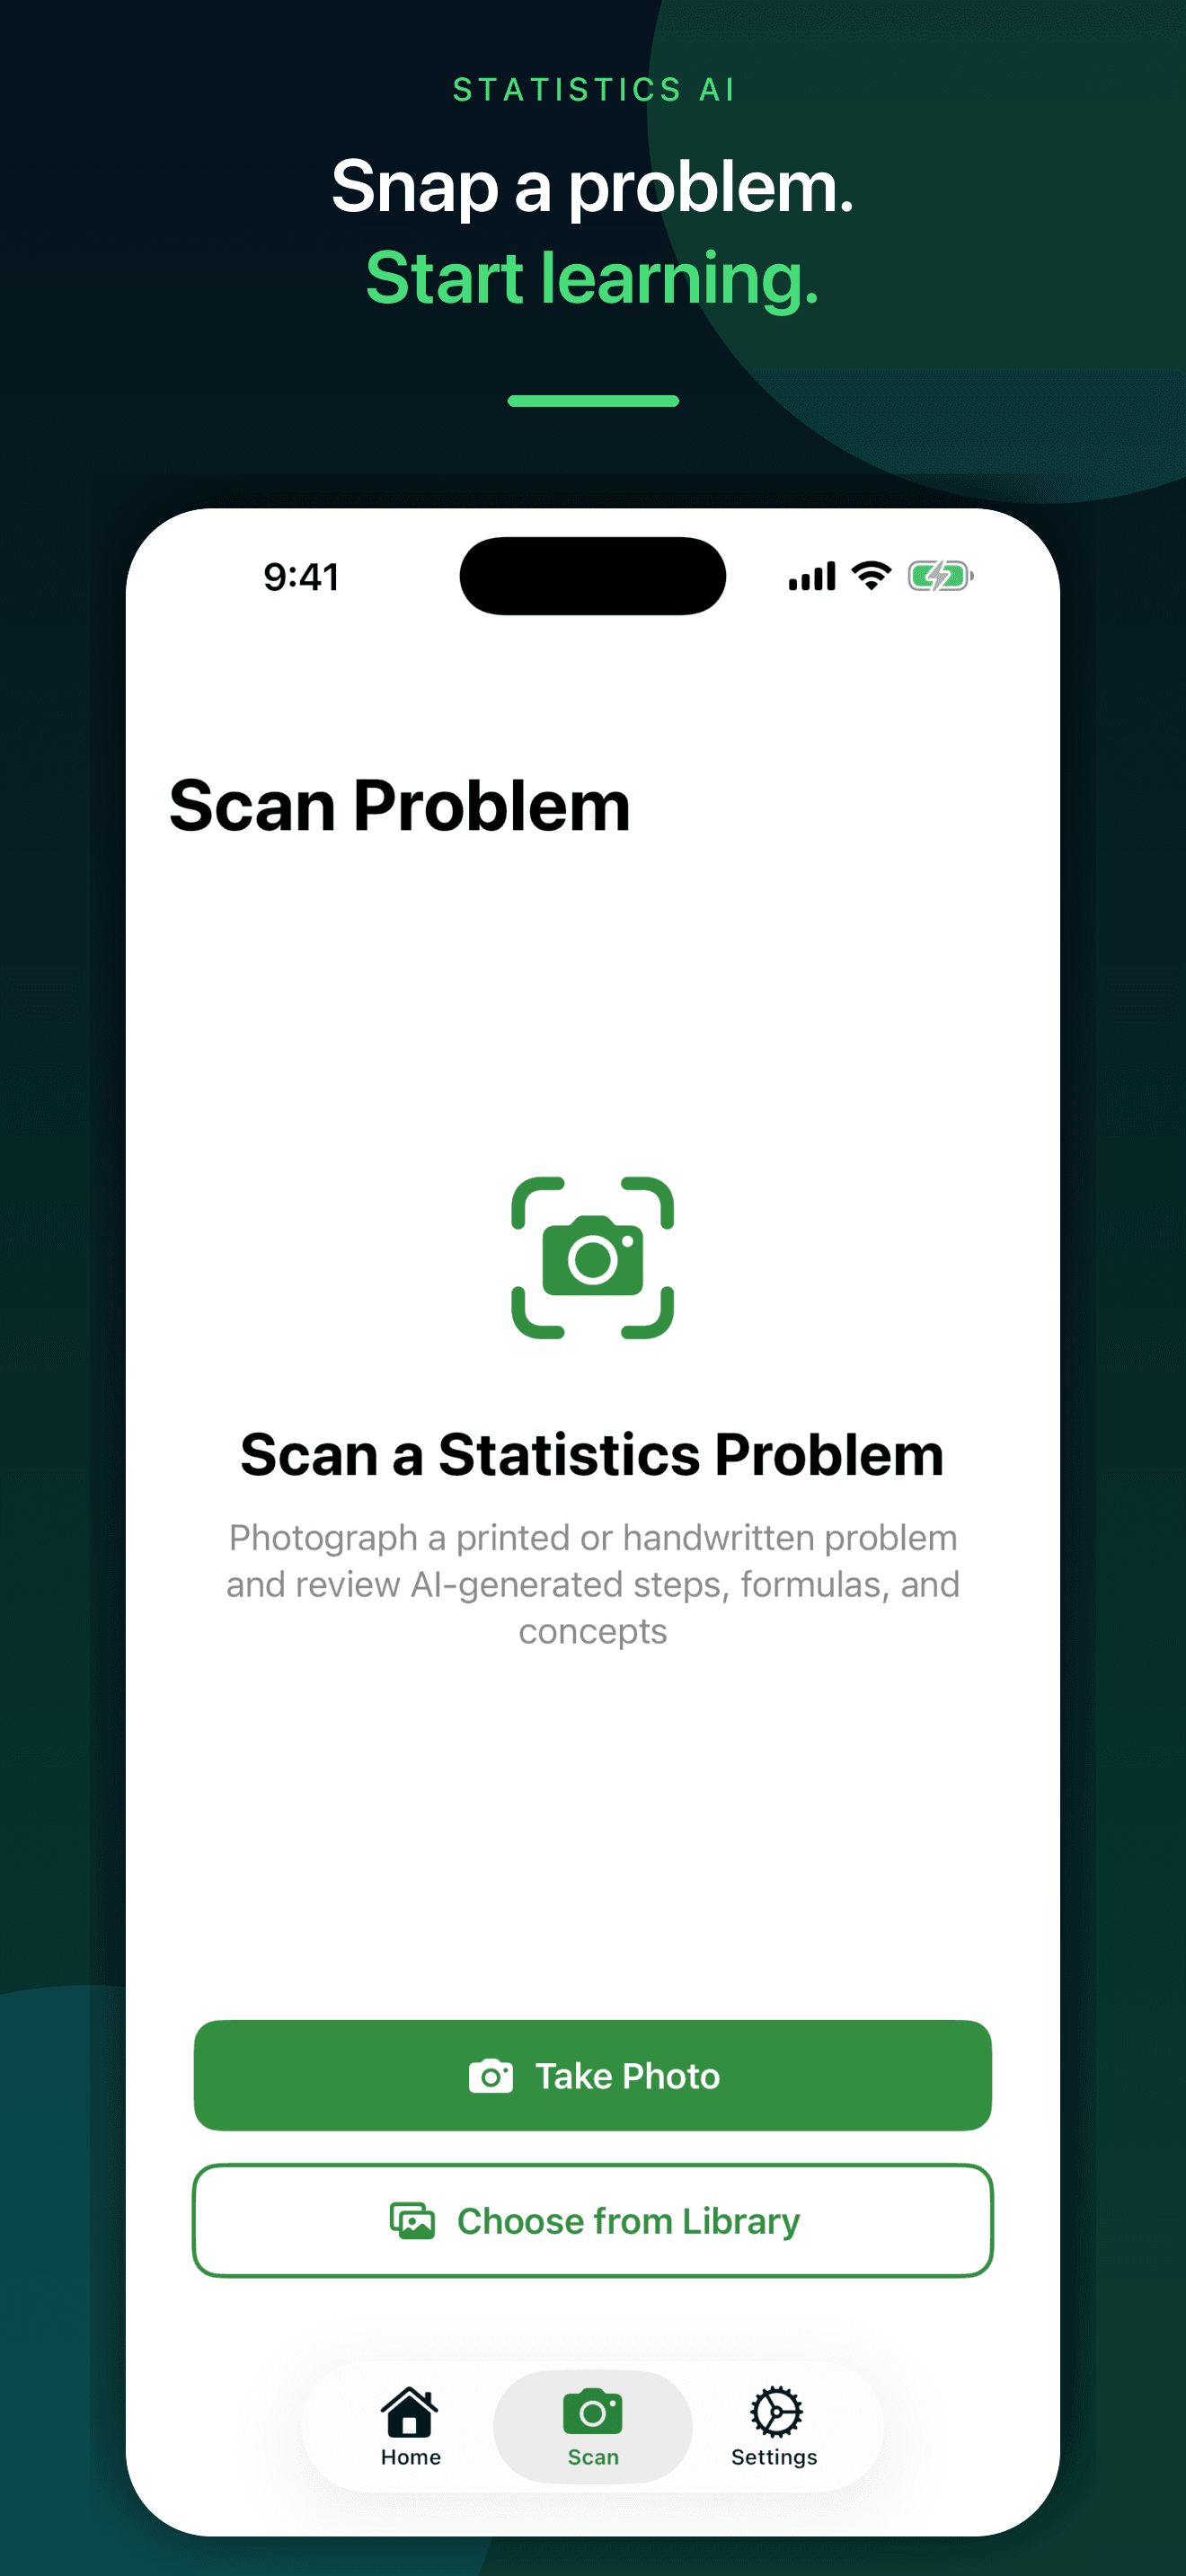
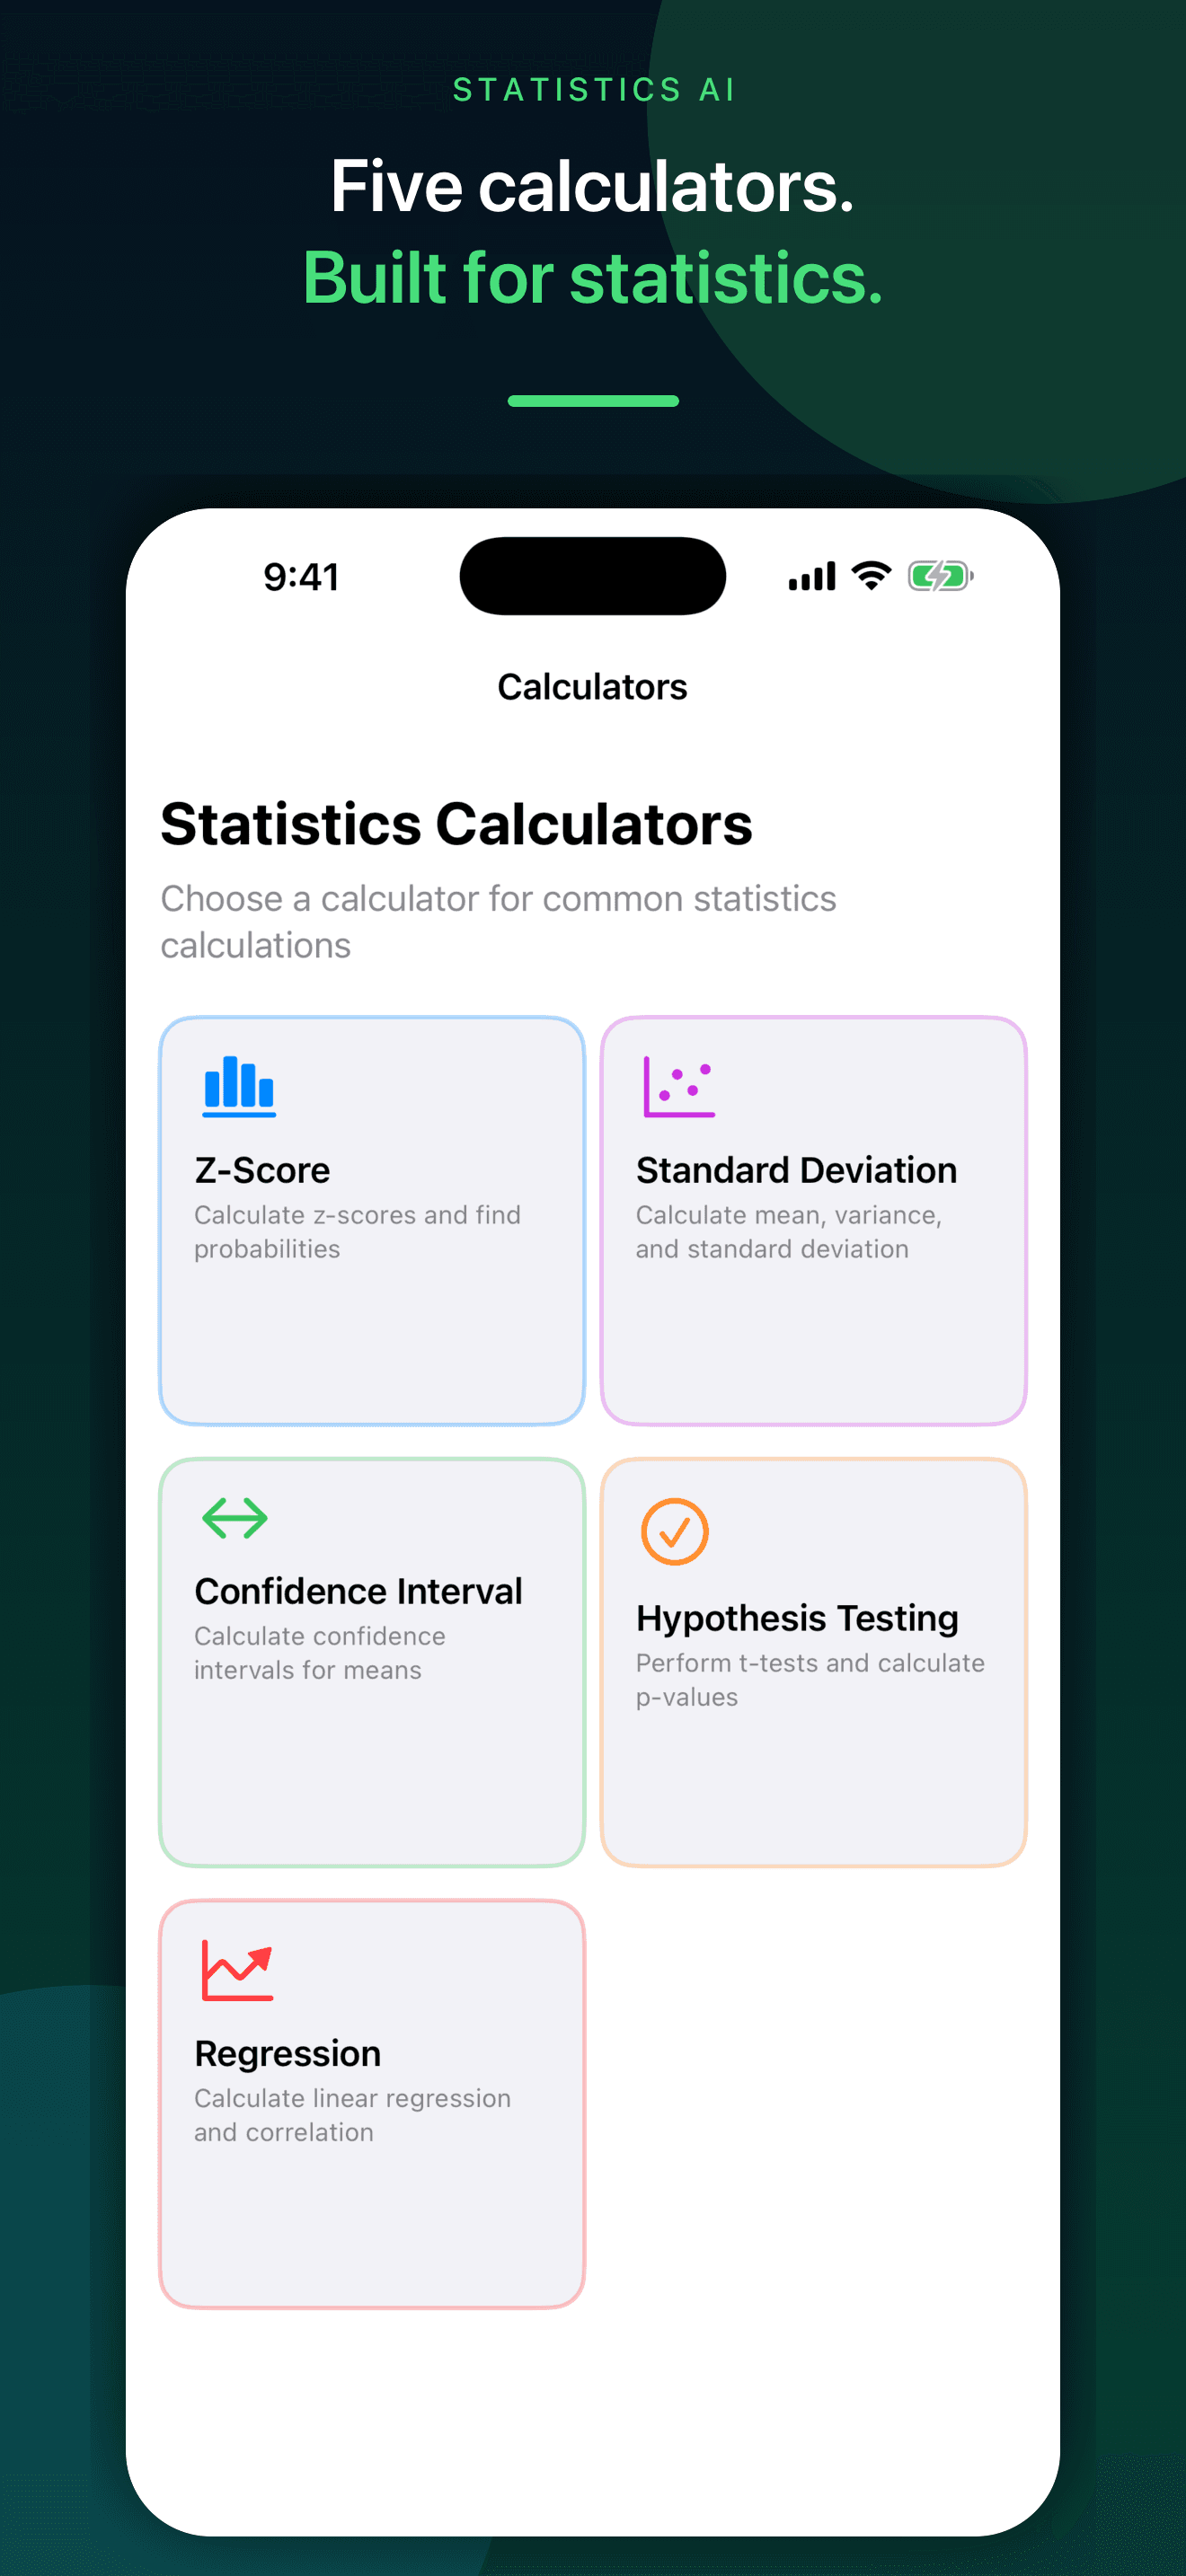
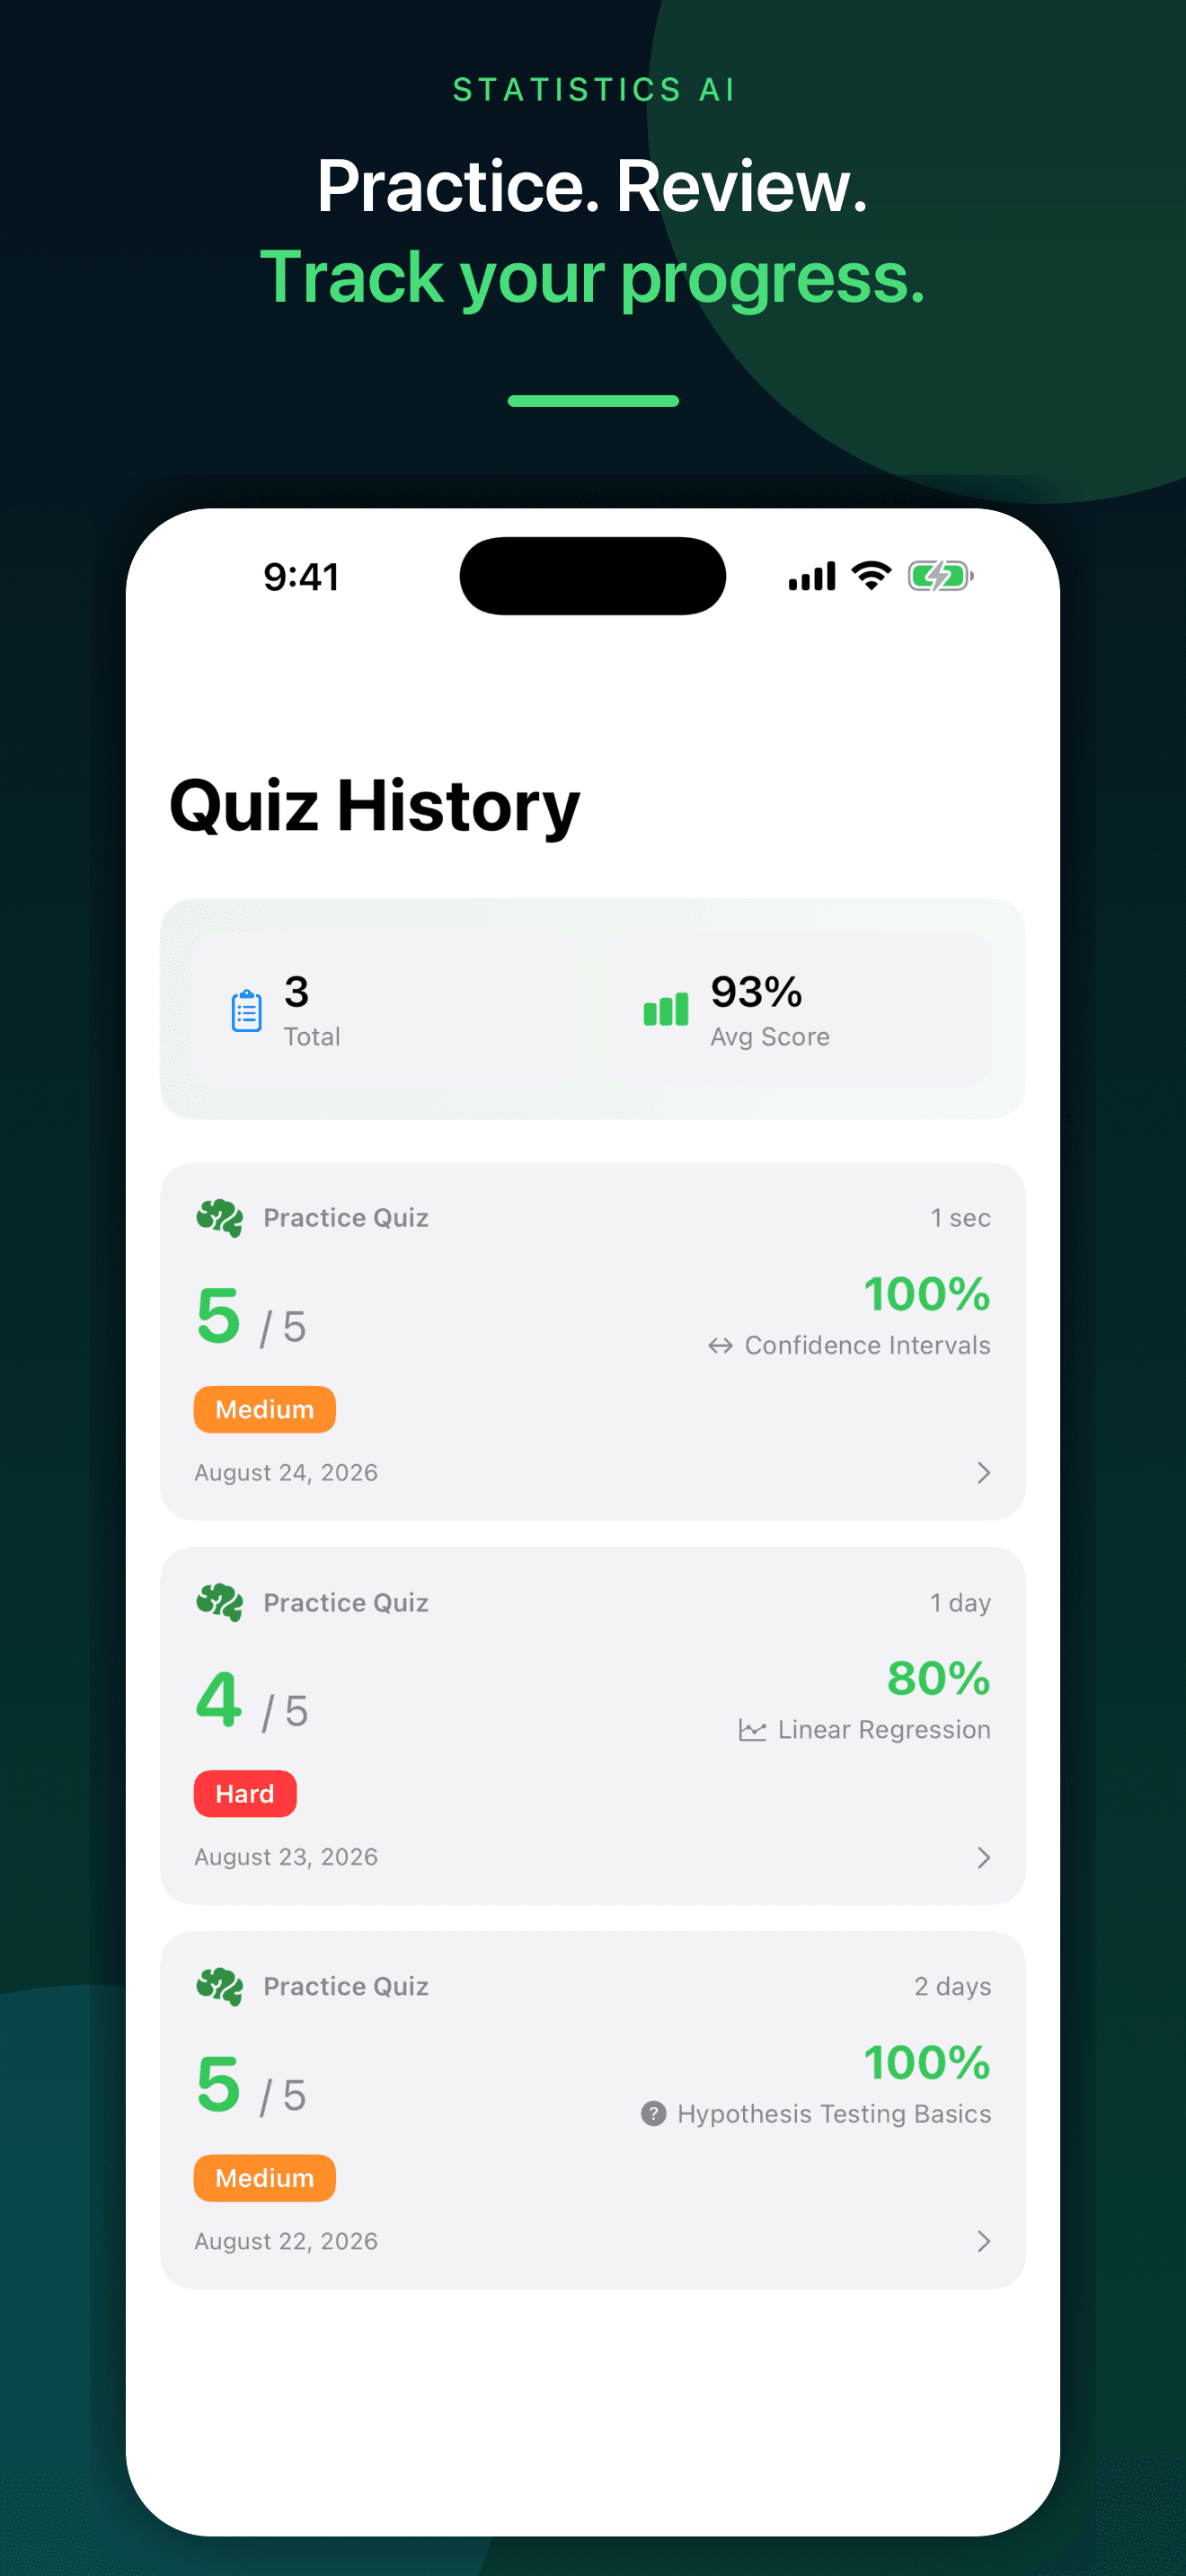
Try the app
Statistics AI can analyze a selected problem, organize a possible solution, provide follow-up explanations, and connect it to focused calculators and study tools. Rebuild the setup yourself and verify important inputs, assumptions, calculations, and conclusions with the assigned material, instructor, or qualified statistician.
Statistics and learning references
These statistics-education, reference, and learning-science sources support the study method and limits on this page. They do not endorse Statistics AI.
Direct answers
Translate each prompt into a question, population, sample, variables, and design; explore the data; choose a method from the goal and data type; check assumptions and calculations; interpret the result in context; then retrieve the setup without notes and revisit it after a delay.
Learn the formulas required by your course, but connect each one to its parameter, variables, units, assumptions, sampling distribution, and interpretation. Formula recall without knowing when a method applies will not transfer reliably to a new problem.
Build a mixed set of problems from the syllabus, hide the topic labels, and practise choosing the method before calculating. Keep an error log for misread questions, wrong assumptions, formula selection, calculator input, interpretation, and conclusions, then revisit those errors across several sessions.
Statistical significance describes how incompatible the observed data are with a specified null model under stated assumptions. Practical importance concerns whether the estimated effect is large or consequential in context. Report effect size and uncertainty rather than treating a p-value as the size or importance of an effect.
No. An association can reflect confounding, selection, measurement, chance, reverse direction, or other design limitations. Causal conclusions require a design and analysis that justify them; a strong correlation or small p-value alone is not enough.
No. AI can misread data, invent assumptions, select an unsuitable test or model, mishandle missing values, or overstate certainty and causation. Use it to inspect a possible method or create practice, then verify important work independently.
The current release stores saved problems and study data in the app and may sync them through your private Apple iCloud account when available. Content needed for scanning, tutoring, quiz generation, or AI-assisted flashcards is sent through AIProxy to Anthropic for processing. Do not submit sensitive personal data.